
Article
Liver Segmentation Model – Validation, Optimization, and Improvements. (Unpublish)
Leslie M. Wubbel, Gregory Glatzer, Rishyak Panchel, Alex Schweizer, Nathan Reilly, Nathaniel Leies, Shubhang Sharma, Vaibhav Gupta, Ethan Wright
From OpenVessel Conflicts of interest are listed at the end of this article.
Abstract
In state-of-the-art computer vision applications of neural networks (NNs) and machine learning (ML) algorithms will find its impact in medicine for the coming decades with regulatory bodies and medical institutions seeking technical insight on the specifications, standards, and validation to determine acceptance into the market, as a Food Drug Administration (FDA) approved technology for patients.
This is a study in reproducibility of past work it’s the validation of prior models. Deep learning requires many hours of development, research, and large datasets composed of millions of images. Currently though the access to datasets of this size that pertain to the specific medical problems are not easily accessible or even in existence.
However medical computer vision research has overcome small dataset size by finally implementing deep learning in a clinically setting to build a larger dataset for breast cancer or with novel models such as U-net. The field has addressed this problem by designing systems that augment the dataset from a small size to millions of images by flipping, cropping, or generating millions of similar images to train the network. For example, U-net, a fully convolutional network, was designed to augment the dataset with prerequisites that the data is well annotated. U-net has become a popular application for biomedical images, pathology, and CT/MRI segmentation. [1] Handling pixel features when objects are touching close to the same class of pixels, as seen in microscope slides of bacteria or CT images of organs. [1] Success for deep learning applications was found specifically in breast density assessment (BI-RADs) used as a technique in mammography diagnosis, the networks results were compared against the human radiologist results proved to be significant and was implemented in CAD aided diagnosis.[2] Due to these successes entire industries (start-ups) of computer vision applications appeared in the last decade promising the detection of tumors, abnormalities in the image data of the lungs for general set of lung diseases, COPD, pneumonia, lung cancer.
Even Larger industries such as GE healthcare, Philips healthcare, and Siemens healthineers who manufacture the MRI/CT scanners are also promising automated methods of interpretation. For example Siemens has automatic liver segmentation method not fully described that has appeared in the form of non-commercialized prototype (NeuronX) tested on 5000 CT scans, the results described represents processing time 9.94s compared to manually segmentation 219.34s are impressive at first glance.[3] However, the results of automatic method and manual method were evaluated using patient-wise z-score, Cohen’s Coefficient K, measures analysis of variance (ANOVA), Interclass correlation coefficient (ICC).[3] These methods of evaluations are not commonly seen as the methods to evaluate segmentation results or the predicting behavior of the model. Instead, global DICE score, DICE score per case (patient), Jaccard index, and Volume Overlap Error (VOE) have been used by the LiTS benchmark 3 years.
Barcelona’s Model – Preceptive
Barcelona’s techniques and strategies dealt with imbalance of the dataset, which proved to be challenging. Imbalance as shown in Figure 1, the number of images not containing liver outnumber images containing liver (white pixels). Barcelona implemented a “weighted” binary cross entropy cost function to overcome the issues of imbalance. Barcelona’s balancing strategy uses general balancing across the entire dataset, considering only the positive samples of the class. The balanced weights were calculated globally, so that all CT volumes participated in the learning process.[5] As mentioned by Barcelona’s efforts the ideal situation would be the removal of any balancing terms and define a region of interest which would be distributed as balanced between the number of positive/false pixels. Barcelona’s conclusion tells us that liver segmentation takes advantage of its prediction in order to predict the segmentation of lesions inside the liver. Finally, the next approach would be by limiting the samples leverages or the imbalance between positive and negative pixels.

Figure 1 The number of images that do not contain a liver mask outnumber images containing a liver mask. Binarized images of entire CT scan.

Validation of Barcelona’s Model
For validation, Barcelona’s model was trained, validated, and applied on the LiTS dataset. The weights performed as descripted when testing was run on LiTS dataset CT scans 105 – 130 CT scans but when utilizing the evaluation tool provide by LiTS dataset at https://github.com/PatrickChrist/LITS-CHALLENGE. Requires that inputs of predicted results be formatted in .nii however Barcelona model only outputs its results as PNG which had to be convert .nii files to evaluate against ground truth the liver Violation of expectation (VOE) at table 3 shows that however the total liver DICE score calculated via per slice basis, is low as shown in table 3.
Reproducibility of Barcelona’s proved to be challenging due to unforeseen problems loss was not normalized and OpenVessel implemented normalization by dividing the total loss by (512*512) input size of the image before loss effected the weights. To reproduce Barcelona’s results, we review their Github repo https://github.com/imatge-upc/liverseg-2017-nipsws, workshop paper, related slides, and Master thesis related to the project. These papers gave insights to environment that generated such a project
However, to reproduce the experiment came with challenges the architecture was built on TensorFlow 1.X a framework for deep learning that has deprecated extensively since 2017 TensorFlow 2.X and Pytorch are now more update with handling. Since the framework is out of date this comes with extensive problems TensorFlow documentation has been removed or hard to find, complied binaries for different operating system are not easily accessible in software package managers since python 2.7 removal from them. Appending new CT scans to dataset preventing training improvements, inputs were not normalized, and random seeding was not implemented.
Optimization and Improvements
For Optimization and Improvements, preprocessing methods were implemented to affect the dataset itself as mentioned in Barcelona’s efforts the dataset is severally imbalance as the number of images not containing liver outnumber the number images with the liver.[10] The number of pixels on the image outnumber the pixels that are classified as liver further compounding the challenge. The size and number of pixels themselves of the lesions are smaller than the liver and the entire CT scan in its entirety.
OpenVessel’s improvements started with Barcelona Model (2017) We validated it by rebuilding the model running ‘testing’ apply the models function on the LiTS dataset to evaluate performance of weights that Barcelona generated [insert DICE score number here] . We automated the manually steps of Barcelona’s Model for ease of data scientist team to test and running modified or mutated versions of the models as shown in reference table 1. The development of such models are made in juypter notebooks or google collabs this prevents scaling large methods for testing models with several different modifications and comparison of results to further test for optimization methods to increase DICE score or performance. With so many improvements made on top of model we associate the name as OpenVessel Liver Lesion Detection model.
Liver Detection Model
Liver detection model finds the slices containing liver versus slices not containing liver. https://github.com/OpenVessel/liver_detection_model
3D bounding box
The dataset size was increased with 20 patients containing liver lesion specifically for the identification LI-RADs categorization and classification. The LI-RADs dataset has 20 patient CT scans each with 3 series scans of non-contrast, Arterial, Portal Venous in total 60 series scan. Each CT scan contains various levels of LI-RADs grading system labels refer to as ground truth. Thirty percent of (6 of 20) scans were reserved for testing.
Cascading architecture
The Fully automatic network is also known as Cascading architecture which means the liver segmentation, lesion detection, and lesion segmentation all results feed into the next model. When the liver segmentation step is completed, its results are used as inputs into lesion detection model. The original process map describing the network architecture is shown below has been update to figure 2.

Figure 1. The process map created by Barcelona research group describing Liver segmentation, bounding box sample, and Lesion Segmentation. [5]
With this updated figure 2, we can clearly identify that the cascading architecture contains a 3rd model as seen in the code and described in the Barcelona research paper referred to as the lesion detection model with Resnet-50 weights.
The purpose of this figure is clarified and describe each method for improvement and analysis. The fully automated system is broken down into three parts Liver segmentation Network, Lesion Detection Network, and Lesion Segmentation Network. Each of these Networks are trained for their specific task and then their outputs are feed into one another.
Each Segmentation network outputs a predicted image and TensorFlow weights are saved per iteration recording LOSS of their prediction.

Datasets
Liver Tumor Segmentation Benchmark LiTS dataset was built in 2017 based on other datasets that exist at the time 3Dircadb-01, 3Dircadb-02, Sliver ’07, TCGA-LIHC, MIDAS of adnominal CT scans for liver segmentation challenges to invective and create new methods to segment the liver. All the data in LiTS contains full CT scan and corresponding information of labels that exist for the liver and lesion existing on the liver itself. [11] The LiTS dataset is collection of 7 hospitals and research institutions, manually blind reviewed by 3 independent radiologist.
The LiTS Dataset is composed of 130 CT scans from various research from cross the global with additional undisclosed 70 CT scan used as validation dataset to test robustness of the models.
LiTS dataset challenge produced paper evaluating and comparing the results of twenty-four algorithms created to segment the liver and lesion at the automatically as reported the best liver segmentation DICE score of 0.96 by International Conference On Medical Image Computing & Computer Assisted Intervention (MICCAI) and tumor segmentation at DICE of 0.67 International Symposium on Biomedical Imaging (ISBI) and 0.70 (MICCAI) . [11]
Preprocessing
The liver Lesion Detection model Barcelona developed entire system relies on specific preprocessed data nifty files to Matlab and PNGs. The preprocess step calls on a matlab library [6] was written in python 3.7 instead kept on Github source code at
the same functionality was retained. Python packages used to recreate preprocessing step was nibabel and SciPy. [7]
Tge nibabel library loads NIfTI1 files and old ANALYZED format as 3d NumPy array that was processed with HU-value clipping or referred to in prior papers as “hard clipping”. Barcelona at (-150, 250) any pixel values below -150 are set to -150 and any pixel values above 250 are set 250). HU value clipping technique is a frequently used Image processing techniques to narrow the range of values relevant to liver-related values with purpose of improving the DICE or performance of the network to focus only relevant to segmentation task. [11] However as the LiTS paper report there is “no clear consensus” with “significant variation” on optimal HU-values to clipping. [11] Researchers who apply these techniques base their HU-value clipping on the dataset they were given or for optimization of network performance the serious downside is that model will lack the robustness or flexibility of apply their model and its weights to real-world applications. Simply data drift will cause the performance of these models to fail or decreases with development these techniques. Since HU-values are relative quantitative values generated by radiographic process with multifactor that
The NiFTI files given by the LiTS dataset have float point precision when volume.nii is convert to matlab files its float values or HU values are convert to float32 datatype
When labels segmentation.nii are converted to PNGs
Preprocessing methods exist to handle data that would otherwise lower a networks performance but not limit it from its training as to never encounter that data. Preprocessing methods could help with dataset issues that common with medical imaging datasets.
- Different acquisition protocols
- Differing contrast-agents
- Contrast level with variance
- Scanner resolutions
- Tumors/lesions have varying levels of contrast
- Size of lesions
- Shape of lesions
Filtering out the small lesions in the dataset doesn’t solve the problem. The LiTS dataset was create to develop models to handle these myriads of issues. OpenVessel’s efforts were focus on this imbalance issues focus on preprocessing methods that removed the imbalance challenge behind this dataset
Liver detection model as a preprocessing step
3D bounding boxes on the liver as a preprocessing step
| X coordinates | Y coordinates | Z coordinates | |
| Minimum | 36 | 86 | 4 |
| Maximum | 488 | 462 | 783 |
| Average Minimum | 145 | 146 | 212 |
| Average Maximum | 429 | 392 | 353 |
Statistical analysis was done on the LiTS dataset to find the X,Y,Z coordinates for find the average minimum and maximum of all values to create 3D bounding of the liver for all patients in LiTS dataset.
Liver segmentation Model
The liver segmentation model Barcelona built, the Architecture is based on DIRU a Fully Convolution Network (FCN) with side outputs at different convolutions to feed feature information to last step of neural network. These outputs have different levels of supervision and loss generate per predictive iteration specific parameters set.
When training of the model begins its reads tf.float32 in as inputs to model, it creates the network, initializes weights from pre-trained model its given, defines loss, level of supervision, and optimization
The liver segmentation network reads Matlab file with SciPy library as 3D NumPy array (1, Weight, Height, 3 slices) 3 images as once to create 3D spatial information also referred to as 2.5D.

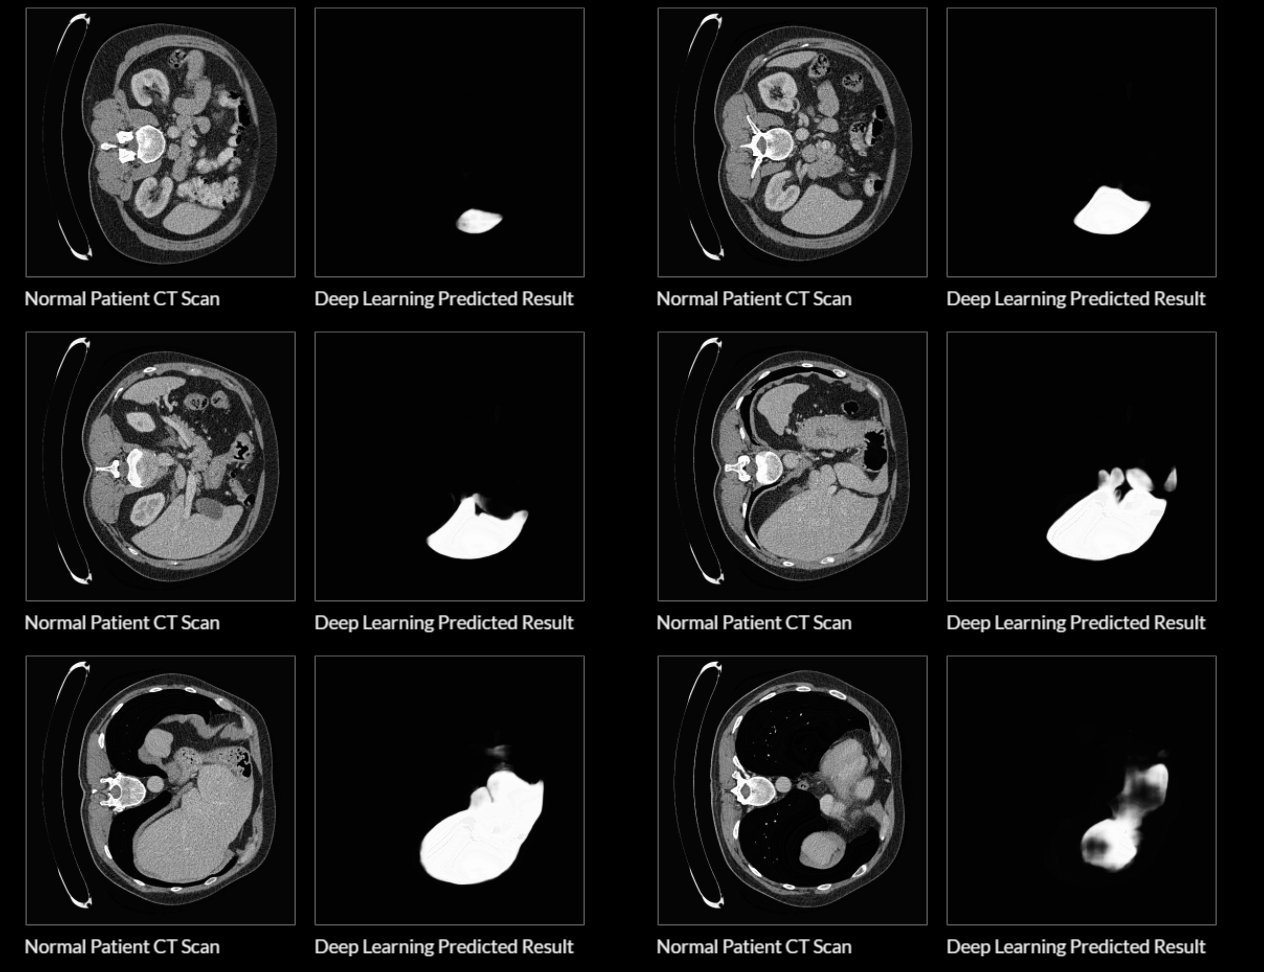
Figure 3. Image on the left-hand is the liver segmentation model’s predication compared against human radiologist label representing slice 412 of patient 117 for validation of the model. This is slice represent a single image results out of 54,000 images.
Preprocessing step for lesion detection
The results of liver segmentation model output a predicted liver mask of foreground white pixels and background of black pixels as shown in figure 3 image on the left. 3D bounding box is apply on the liver image that is binarized from the liver segmentation model. Grey scale of pixels is normalized between (0-1) Any pixel value greater than 0.5 is set to 1 and any pixel value less than 0.5 is set to 0. The coordinates (a,b) are where foreground pixels are found to acquire the maximum and minimum of the liver image to apply the bounding.
Barcelona model normalizes the liver mask for lesion detection system possible triggering false positives in the lesion detection network.
To feed the information into the lesion detection sample 80×80 bounding boxes are to speed up computation & better accuracy.


Figure 4 . Application of bounding box to liver segmentation results on single slice or liver image
Lesion Detection
The lesion detection network sample’s locations around the liver taking small bounding boxes to processed into model. The lesion detection network asses these bounding boxes finding many false positives is common occurrence for detection to because its detection results will be classified as either lesion or not lesion the next step.

Radiologist Label

Liver Detections Model for Lesions Labeling
Results:
The Barcelona model and team accomplished was the preprocess step known as binarization on HU values range of (-150, 250) DICE of the liver segmentation was 0.942 then lesion segmentation 0.318 The reproduced results of liver segmentation was 0.1885 and lesion 0.6618.
Liver Detection model apply before the preprocessing step of Barcelona model will help balance the dataset in terms of how many images contain liver versus not containing liver therefore decreasing training time and increasing DICE score.
We wanted to apply the 3D bounding box apply to all images to reduce the number of pixels being processing before liver segmentation occurs using statistical analysis on GT liver mask to create bounding boxes. However do to not moving forward with client the project stopped.
| Preprocessing method + Architecture | DICE | Training Time | Loss | Hardware |
| Barcelona Model | 0.1885 | 11 days | 0.6618 | 2080 TI |
| Validation of Barcelona (not normalized) | 0 | 22 days | 0.6618 | 2080 TI |
| Validation Barcelona (normalized loss) | 0 | 17 days | 5.741 e-3 | Qudro |
| Liver Detection + Openvessel modification (normalization of loss) | 0.2872 | 12 days | 0.2607 | 2080 TI |
Table 1. Results for Running Barcelona Model before and after improvements
| Operator | Date | Hardware | OS | Runtime | Version of python |
| Nathan Rielly | 1/31/2021 | I5 Intel 9400, 16gb RAM | Ubuntu 20.04 | 26 minutes 33 seconds | Python 3.7 |
| Rishyak Panchel | 1/20/2021 | I9 Intel, 64 gbs of RAM | MacOS | 43.5 minutes | Python 2.7 |
| Leslie M. Wubbel | 1/31/2021 | I7 Intel, 16 gb RAM | Windows | 32 minutes | Python 2.7 |
| Nathan Rielly | 2/1/2021 | I5 Intel 9400, 16 gb ram | Ubuntu 20.04 | 25 minutes | Python 2.7 |
Table 2. Preprocessing Script volume.nii and segmentation.nii files convert to matlab and pngs
| Volume | Liver_voe | Liver dice | Liver_rvd | Liver_assd | Liver_jaccard | Liver_msd |
| D:\L_pipe\liver_open\liverseg-2017-nipsws\comparsion\segmentation-104.nii | 0.991360376 | 0.017131241 | -0.34867 | 99.70979 | 0.00864 | 401.3125 |
| D:\L_pipe\liver_open\liverseg-2017-nipsws\comparsion\segmentation-105.nii | 0.999433958 | 0.001131444 | -0.32812 | 141.284 | 0.000566 | 493.7162 |
| D:\L_pipe\liver_open\liverseg-2017-nipsws\comparsion\segmentation-106.nii | 0.996000562 | 0.007967012 | -0.43251 | 105.3883 | 0.003999 | 409.7753 |
| D:\L_pipe\liver_open\liverseg-2017-nipsws\comparsion\segmentation-107.nii | 0.997429965 | 0.005126893 | -0.25092 | 117.6506 | 0.00257 | 418.1801 |
| D:\L_pipe\liver_open\liverseg-2017-nipsws\comparsion\segmentation-108.nii | 0.980146291 | 0.038934425 | -0.32243 | 88.3058 | 0.019854 | 455.8636 |
| D:\L_pipe\liver_open\liverseg-2017-nipsws\comparsion\segmentation-109.nii | 0.99880037 | 0.002396385 | -0.31693 | 120.5018 | 0.0012 | 433.5631 |
| D:\L_pipe\liver_open\liverseg-2017-nipsws\comparsion\segmentation-110.nii | 0.941081683 | 0.111280191 | -0.30915 | 77.37642 | 0.058918 | 420.0465 |
| D:\L_pipe\liver_open\liverseg-2017-nipsws\comparsion\segmentation-111.nii | 0.999225187 | 0.001548426 | -0.28527 | 117.041 | 0.000775 | 425.7229 |
| D:\L_pipe\liver_open\liverseg-2017-nipsws\comparsion\segmentation-112.nii | 0.996297782 | 0.007377125 | -0.3643 | 105.2885 | 0.003702 | 391.8541 |
| D:\L_pipe\liver_open\liverseg-2017-nipsws\comparsion\segmentation-113.nii | 0.99573196 | 0.008499802 | -0.34647 | 121.4466 | 0.004268 | 484.8517 |
| D:\L_pipe\liver_open\liverseg-2017-nipsws\comparsion\segmentation-114.nii | 0.961323046 | 0.0744735 | -0.28899 | 99.24213 | 0.038677 | 455.9365 |
| D:\L_pipe\liver_open\liverseg-2017-nipsws\comparsion\segmentation-115.nii | 0.999999363 | 1.27E-06 | -0.45803 | 129.1565 | 6.37E-07 | 489.5355 |
Table 2. Results of LITS-Challenge evaluation notebook of Barcelona model’s weights how they perform as liver segmentation against the ground truth
The dataset size was increased with 20 patients containing liver lesion specifically for the identification LI-RADs categorization and classification. The LI-RADs dataset has 20 patient CT scans each with 3 series scans of non-contrast, Arterial, Portal Venous in total 60 series scan. Each CT scan contains various levels of LI-RADs grading system labels refer to as ground truth. Thirty percent of (6 of 20) scans were reserved for testing.
Conclusion &Discussion
Evaluation and Validation of Barcelona Model
Deep learning model development is two parts training and validation. When Barcolona model trains it validates concurrently and the evaluation of the predicted results specifically the output of the model is also assessed not just the model itself.
https://github.com/PatrickChrist/LITS-CHALLENGE
Dice score is used to measure the similarity between the predict sample versus ground truth samples, this method is used to evaluate the accuracy of image segmentation networks.
Analyzation of Liver Detection metrics
The DICE obtain is not what we expected to achieve when training this model on a refined dataset. The expected output is a replication of the original model trained by Barcelona. Perhaps training time in less time due to the reduced amount of data being processed. However, neither of these outcomes were realized, as our results are nowhere near the original results of Barcelona. The dice score coefficient of 0 at the end of 34.88 k iterations for both training and testing essentially means that our model was able to correctly segment the liver with an accuracy of 0 percent. This result is not indicative of an improvement, or even a replication, of the performance of the original Barcelona model.
There may be a few reasons for this poor of a performance. First, the model used to discern whether a certain PNG contained a liver, which if it did it would be included in the dataset, was not extensively trained. The total number of patients used to train this preprocessing step ‘Liver detection’ model was around 20, where each patient contained on average around 400 PNGs, meaning the model only saw around 8,000 images. This is nowhere near enough files necessary to create a robust enough model for this specific task. However, to circumvent this minor flaw in the model, a range function was used to decide whether a file was to be included in the refined dataset. The range function took the smallest and largest PNG file numbers and included all files within plus or minus ten percent of that range. For example, if the model identified the range to be from 10.png to 50.png, the range function kept files 6.png to 54.png to be confident all liver images were included. This method still did not capture all liver slices, seeing as the model used to determine if a liver was present in the slice may not have identified all slices correctly, and cut off a portion of slices that did in fact contain a liver.
Work Cited
[1] https://github.com/milesial/Pytorch-UNet
[2] https://www.acr.org/Clinical-Resources/Reporting-and-Data-Systems/Bi-Rads
[3] Winkel, David & Breit, Hanns-Christian & Weikert, Thomas & Stieltjes, Bram. (2021). Building Large-Scale Quantitative Imaging Databases with Multi-Scale Deep Reinforcement Learning: Initial Experience with Whole-Body Organ Volumetric Analyses. Journal of Digital Imaging. 34. 10.1007/s10278-020-00398-y.
[4] Mammographic Breast Density Assessment Using Deep Learning: Clinical Implementation Constance D. Lehman, Adam Yala, Tal Schuster, Brian Dontchos, Manisha Bahl, Kyle Swanson, and Regina Barzilay Radiology 2019 290:1, 52-58
[5] Rouger, Melisande, et al. “Medical Imaging AI: the Bubble Will Break in 2-3 Years.” AI Blog, 19 Feb. 2019, ai.myesr.org/healthcare/medical-imaging-ai-the-bubble-will-break-in-2-3-years.
[5] Miriam Bellver, Kevis-Kokitsi Maninis, Jordi Pont-Tuset, Xavier Giro-i-Nieto, Jordi Torres, & Luc Van Gool. (2017). Detection-aided liver lesion segmentation using deep learning.
[6] Shen Jimmy, Tools for NIfTI and ANALYZE image, versions 1.27.0 https://www.mathworks.com/matlabcentral/fileexchange/8797-tools-for-nifti-and-analyze-image
[7] Brett, Matthew, Markiewicz, Christopher J., Hanke, Michael, Côté, Marc-Alexandre, Cipollini, Ben, McCarthy, Paul, … freec84. (2020, November 28). nipy/nibabel: 3.2.1 (Version 3.2.1). Zenodo. http://doi.org/10.5281/zenodo.4295521
[8] Patrick Bilic, Patrick Ferdinand Christ, Eugene Vorontsov, Grzegorz Chlebus, Hao Chen, Qi Dou, Chi-Wing Fu, Xiao Han, Pheng-Ann Heng, Jürgen Hesser, Samuel Kadoury, Tomasz Konopczynski, Miao Le, Chunming Li, Xiaomeng Li, Jana Lipkovà, John Lowengrub, Hans Meine, Jan Hendrik Moltz, Chris Pal, Marie Piraud, Xiaojuan Qi, Jin Qi, Markus Rempfler, Karsten Roth, Andrea Schenk, Anjany Sekuboyina, Eugene Vorontsov, Ping Zhou, Christian Hülsemeyer, Marcel Beetz, Florian Ettlinger, Felix Gruen, Georgios Kaissis, Fabian Lohöfer, Rickmer Braren, Julian Holch, Felix Hofmann, Wieland Sommer, Volker Heinemann, Colin Jacobs, Gabriel Efrain Humpire Mamani, Bram van Ginneken, Gabriel Chartrand, An Tang, Michal Drozdzal, Avi Ben-Cohen, Eyal Klang, Marianne M. Amitai, Eli Konen, Hayit Greenspan, Johan Moreau, Alexandre Hostettler, Luc Soler, Refael Vivanti, Adi Szeskin, Naama Lev-Cohain, Jacob Sosna, Leo Joskowicz, & Bjoern H. Menze. (2019). The Liver Tumor Segmentation Benchmark (LiTS).
[9] S. Caelles, K.K. Maninis, J. Pont-Tuset, L. Leal-Taixé, D. Cremers, & L. Van Gool (2017). One-Shot Video Object Segmentation. In Computer Vision and Pattern Recognition (CVPR).\
[10] Bellver , M. B. (2017). Detection-aided medical image segmentation using deep learning Master thesis. UNIVERSITAT POLITECNICA DE CATALUNYA BARCELONATECH.
[11] Patrick Bilic and Patrick Ferdinand Christ and Eugene Vorontsov and Grzegorz Chlebus and Hao Chen and Qi Dou and Chi-Wing Fu and Xiao Han and Pheng-Ann Heng and Jürgen Hesser and Samuel Kadoury and Tomasz K. Konopczynski and Miao Le and Chunming Li and Xiaomeng Li and Jana Lipková and John S. Lowengrub and Hans Meine and Jan Hendrik Moltz and Chris Pal and Marie Piraud and Xiaojuan Qi and Jin Qi and Markus Rempfler and Karsten Roth and Andrea Schenk and Anjany Sekuboyina and Ping Zhou and Christian Hülsemeyer and Marcel Beetz and Florian Ettlinger and Felix Grün and Georgios Kaissis and Fabian Lohöfer and Rickmer Braren and Julian Holch and Felix Hofmann and Wieland H. Sommer and Volker Heinemann and Colin Jacobs and Gabriel Efrain Humpire Mamani and Bram van Ginneken and Gabriel Chartrand and An Tang and Michal Drozdzal and Avi Ben-Cohen and Eyal Klang and Michal Marianne Amitai and Eli Konen and Hayit Greenspan and Johan Moreau and Alexandre Hostettler and Luc Soler and Refael Vivanti and Adi Szeskin and Naama Lev-Cohain and Jacob Sosna and Leo Joskowicz and Bjoern H. Menze (2019). The Liver Tumor Segmentation Benchmark (LiTS). CoRR, abs/1901.04056.
[12] Automated CT and MRI Liver Segmentation and Biometry Using a Generalized Convolutional Neural Network Kang Wang, Adrija Mamidipalli, Tara Retson, Naeim Bahrami, Kyle Hasenstab, Kevin Blansit, Emily Bass, Timoteo Delgado, Guilherme Cunha, Michael S. Middleton, Rohit Loomba, Brent A. Neuschwander-Tetri, Claude B. Sirlin, Albert Hsiao, and on behalf of the members of the NASH Clinical Research Network Radiology: Artificial Intelligence 2019 1:2
Appendix
Appendix A – Configuration Parameters
Appendix B – Data table
| Date | Model | Weights | Total Loss | DICE | Training time | Iterations | OS | Hardware |
| 3/16/2021 | Liver lesion detection system (baseline) | vgg-16 | 41.35 | 0.1885 | 11 days | 50k | Windows | SUPER 1650 |
| 3/23/2021 | Liver lesion detection system – Barcelona not normalized | vgg-16 | 0.6618 | 0 | 22 days | 50k | Ubuntu 18.04 | 2080 TI |
| 3/22/2021 | Liver lesion detection system – Barcelona not normalized | vgg-16 | 5.741 e-3 | 0 | 17 days | 50k | Ubuntu 18.04 | Quadro |
| 4/8/2021 | Liver lesion detection system – Barcelona normalized | vgg-16 | 0.1412 | 0 | 11 days | 42 K | Ubuntu 18.04 | Quadro |
| 4/16/2021 | 3D BB + Liver Lesion Detection system | vgg-16 | Ubuntu 18.04 | NVIDIA GeForce GTX 1660 | ||||
| 4/16/2021 | Liver Detection + Liver Lesion Detection System | vgg-16 | 0.2607 | 0.2872 | 12 days | 34 K | Ubuntu 18.04 | 2080 TI |
| 4/27/2021 | Liver Lesion Detection System | seg_liver_ck (Barcelona weights) | Ubuntu 18.04 | NVIDIA GeForce GTX 1660 | ||||
| 4/27/2021 | VB model + Liver Lesion Detection System | seg_liver_ck (Barcelona weights) | Ubuntu 18.04 | 2080 TI |
Data table 1. All experiments run since January to May 5th The record Total Loss and DICE scores are validation of predication of the model’s training. The Barcelona model was not normalize
| Date | Model | Links to datastore (Zenodo) |
| 3/16/2021 | Liver lesion detection system (baseline) | |
| 3/23/2021 | Liver lesion detection system – Barcelona not normalized | |
| 3/22/2021 | Liver lesion detection system – Barcelona not normalized | |
| 4/8/2021 | Liver lesion detection system – Barcelona normalized | |
| 4/16/2021 | 3D BB + Liver Lesion Detection system | |
| 4/16/2021 | VB model + Liver Lesion Detection System | |
| 4/27/2021 | Liver Lesion Detection System | |
| 4/27/2021 | VB model + Liver Lesion Detection System |
Data table 2. Link to zenodo where our weights are store for further analysis
| Type | Start Value (iteration 38) | End Value |
| dsn_2 loss | 3.74E+04 | 3.71E+04 |
| dsn_3 loss | 3.76E+04 | 3.72E+04 |
| dsn_4 loss | 3.78E+04 | 3.78E+04 |
| dsn_5 loss | 3.76E+04 | 3.76E+04 |
| main loss | 3.77E+04 | 3.62E+04 |
| total loss | 7.18E-01 | 0.1382 |
| total loss1 | 7.18E-01 | 1.38E-01 |
| dice coef | 0.00E+00 | 0.00E+00 |
Data Table 3. Baseline results ( 3/16/2021)
Notes on Data – Table 1.
The Liver Lesion Detection or Barcelona model was normalized training run for 15 k iteration while Testing or “Validation” ran for 50K due to computer crashing/loss connection via ssh.
Notes on Data Table 3.
From the model trained on a pre-filtered dataset of images containing only the liver, we were able to obtain metrics up to iteration 34.88 k, before connection was interrupted and training was stopped. The metrics, including dsn_2, dsn_3, dsn_4, dsn_5, main, and total loss, as well as DICE score, were not as we had hoped. The collection of these metrics for training and testing are included in the table below:
Appendix C Figures of Data Table
These values come from Tensorboard graphs that were generated using the .ckpt file produced after training. The following images are screenshots of those graphs:
To visualize results tensorboard graphs had to be smoothed to 0.99 and toggle y-axis log scale. All graphs accessed
Liver Lesion Detection System Barcelona Baseline not normalized


Figure 5 Liver Lesion detection system Barcelona model not normalize loss 3-22-2021. The training model in orange behavior show loss is on downward trend LOSS 4985 while blue is on shows validation or “test” the ground truth indicates training predication is incorrect at 5.7421 e^-3.

Figure 6 – Liver Lesion Detection System Barcelona model not Normalize loss 3-22-2021. The DICE coefficient the model. The training model in orange its behavior shows DICE is on upward trend DICE of 0.9042 instead the blue or validation “test” ground truth indicates training predication is DICE of 0.
Barcelona Model Normalized Figures

Figure 7 (4/8/2021) Barcelona Model Normalized Training stopped on iteration 15k and Validation or “test” continued to 50k iteration Validation LOSS was at 0.1412 and training LOSS at 0.719

Figure 8 (4/8/2021) Barcelona Model Normalized Training orange plot line stopped on DICE 0 15K and Validation of training stops on iteration 50K validation DICE of 0

Figure 9 – (3/23/2021)Liver Lesion Detection System – Barcelona not normalized validation LOSS 0.618 while training LOSS was at 0.4214

Figure 20 (3/23/2021) Liver Lesion Detection System – Barcelona not normalized validation DICE 0 and Train DICE 0

Figure 11 Liver Detection Model + Liver Lesion Detection System (Barcelona) validation LOSS 0.2607 blue line, and training LOSS 0.2798

Figure 12 Liver Detection Model + Liver Lesion Detection System (Barcelona) validation DICE 0.02876 and training DICE 0.2653